Vastu design is about creating harmony and balance within a living or working environment. One powerful tool that aids in achieving this balance is the zonal bar graph. These graphs help visualize the energy distribution across different zones within a space, ensuring that each area aligns with Vastu principles.
This comprehensive guide will walk you through the process of creating and using zonal bar graphs, offering detailed insights to help you make your space Vastu compliant.
Understanding the Role of Zonal Bar Graphs in Vastu Design
Zonal bar graphs are essential in Vastu design because they provide a clear, visual representation of the energy flow in different areas of a building. By plotting this information, homeowners, and designers can easily see where adjustments are needed to enhance the overall harmony of the space.
These graphs not only simplify the complex principles of Vastu Shastra but also make it easier to implement them effectively.
The Basics of Vastu Architecture
Vastu architecture is rooted in ancient Indian wisdom, focusing on harmonizing human-made structures with the natural world. This system divides a space into different zones, each associated with specific elements like earth, water, fire, air, and space.
The correct balance of these elements within a building leads to enhanced health, prosperity, and well-being for its occupants. Zonal bar graphs help you visualize these elements and their effects on your space.
Why Zonal Analysis is Crucial in Vastu Design
Zonal analysis is a highly important aspect of Vastu design. It involves assessing the energy levels in various parts of a building to ensure they are in harmony with Vastu principles. This analysis helps identify areas that may need modification to enhance their positive energy. Without proper zonal analysis, creating a Vastu-compliant environment becomes challenging.
The Importance of Visual Tools in Vastu
Visual tools like bar graphs make the abstract concepts of Vastu more accessible. These tools offer a straightforward method to compare the energy levels of different zones in a space. By using bar graphs, you can easily identify which areas of your home or office are energetically strong and which ones require adjustments. This visualization aids in making informed decisions when designing or renovating a space.
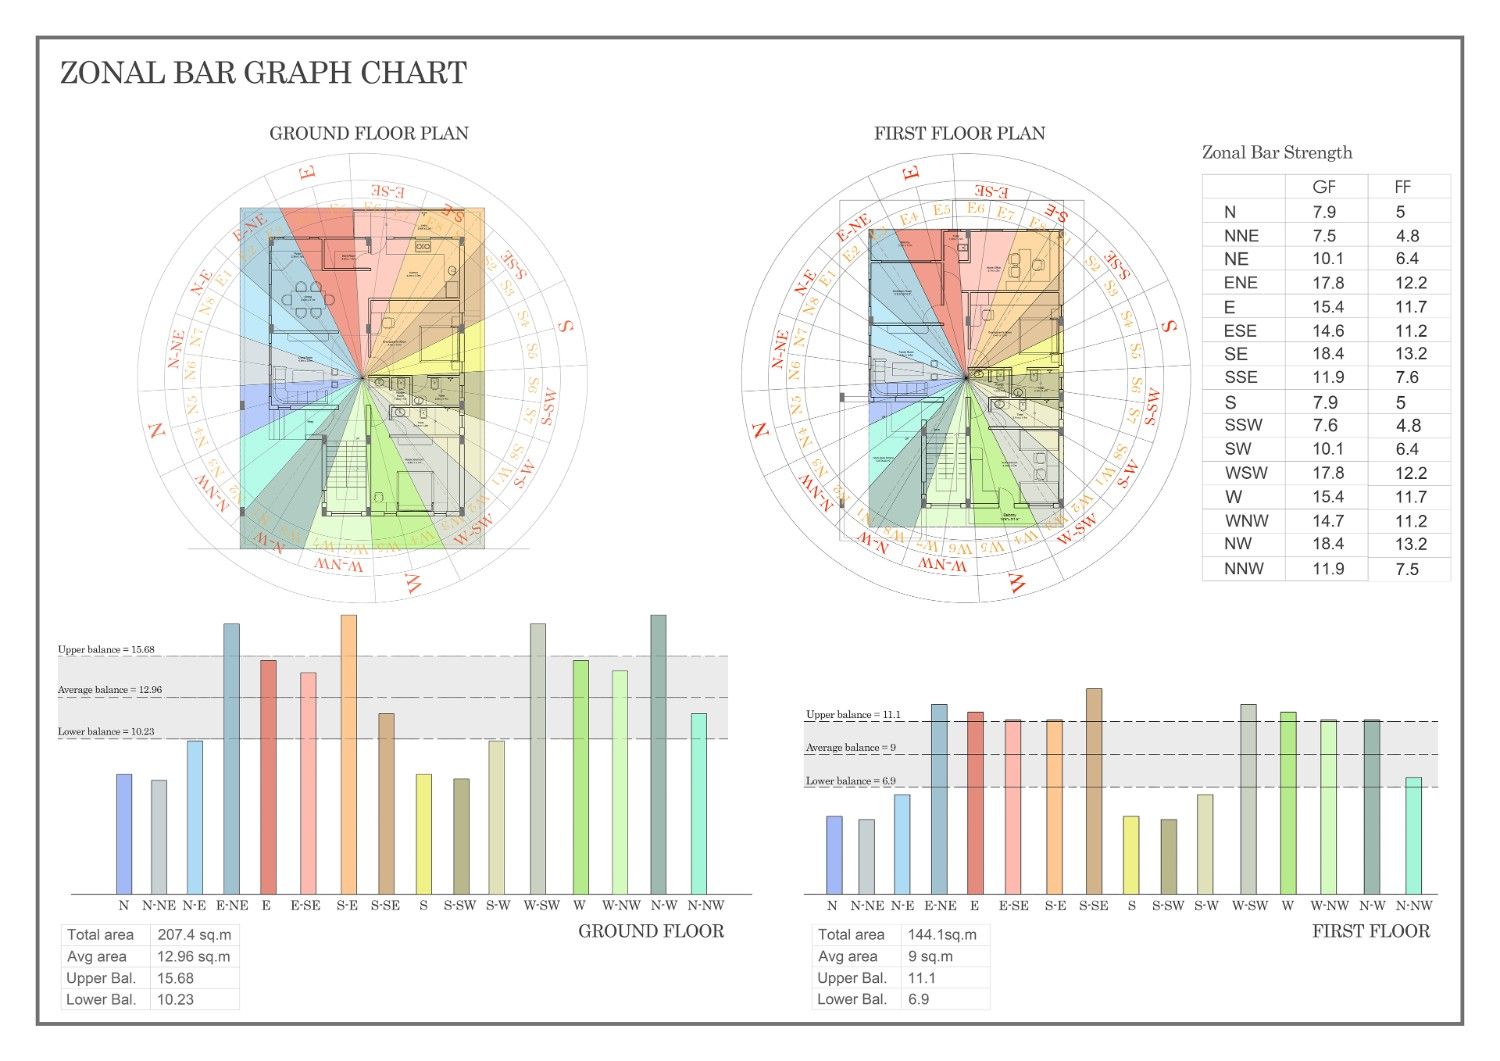
Snippet from Vastu portfolio by Kaarwan student_©Nidhi Panpalia on Behance.net
Step-by-Step Guide to Creating Zonal Bar Graphs
Creating zonal bar graphs is a systematic process that requires careful planning and attention to detail. Below is a step-by-step guide to help you through the process.
Step 1: Identifying the Zones
The first step in creating a zonal bar graph is identifying the various zones within your space. In Vastu design, each zone corresponds to specific elements and energies. For example, the northeast zone is linked to water and prosperity, while the southwest zone is associated with earth and stability. Correctly identifying these zones is crucial for accurate analysis and graphing.
Step 2: Assigning Values to Each Zone
Once you've identified the zones, the next step is to assign values to each one based on their energy levels. These values can be obtained through consultations with Vastu experts, measurements, or personal assessments. Assigning these values allows you to quantify the energy present in each zone, providing the data needed for your bar graph.
Step 3: Choosing the Right Scale
Selecting the appropriate scale for your bar graph is essential for clarity and accuracy. The scale should reflect the range of energy values assigned to your zones. A well-chosen scale will make it easier to compare different zones and identify areas that require modification to align with Vastu principles.
Step 4: Plotting the Bar Graph
After determining your zones and assigning values, it’s time to plot the bar graph. Start by drawing the axes on graph paper or using a digital tool. The horizontal axis should represent the different zones, while the vertical axis should reflect the energy values. Plot each zone’s value as a bar, using different colors to distinguish between zones. This step creates a visual representation of your space's energy distribution.
Common Mistakes to Avoid
While creating zonal bar graphs, it's important to avoid certain common mistakes. These include using inconsistent scales, inaccurately representing data, and neglecting the context of each zone’s energy. Ensuring accuracy at every step will result in a more effective Vastu design.
Step 5: Analyzing the Results
Once your graph is complete, the next step is to analyze the results. Look for patterns and imbalances in the energy distribution across different zones. This analysis will help you understand which areas are harmonious and which require adjustments to align with Vastu principles.
Step 6: Making Adjustments Based on Your Graph
After analyzing your zonal bar graph, you may find that certain zones require adjustments to become Vastu compliant. This step involves making changes to the design or layout of your space to enhance the positive energy flow. These adjustments can include rearranging furniture, incorporating Vastu elements, or even making structural changes.
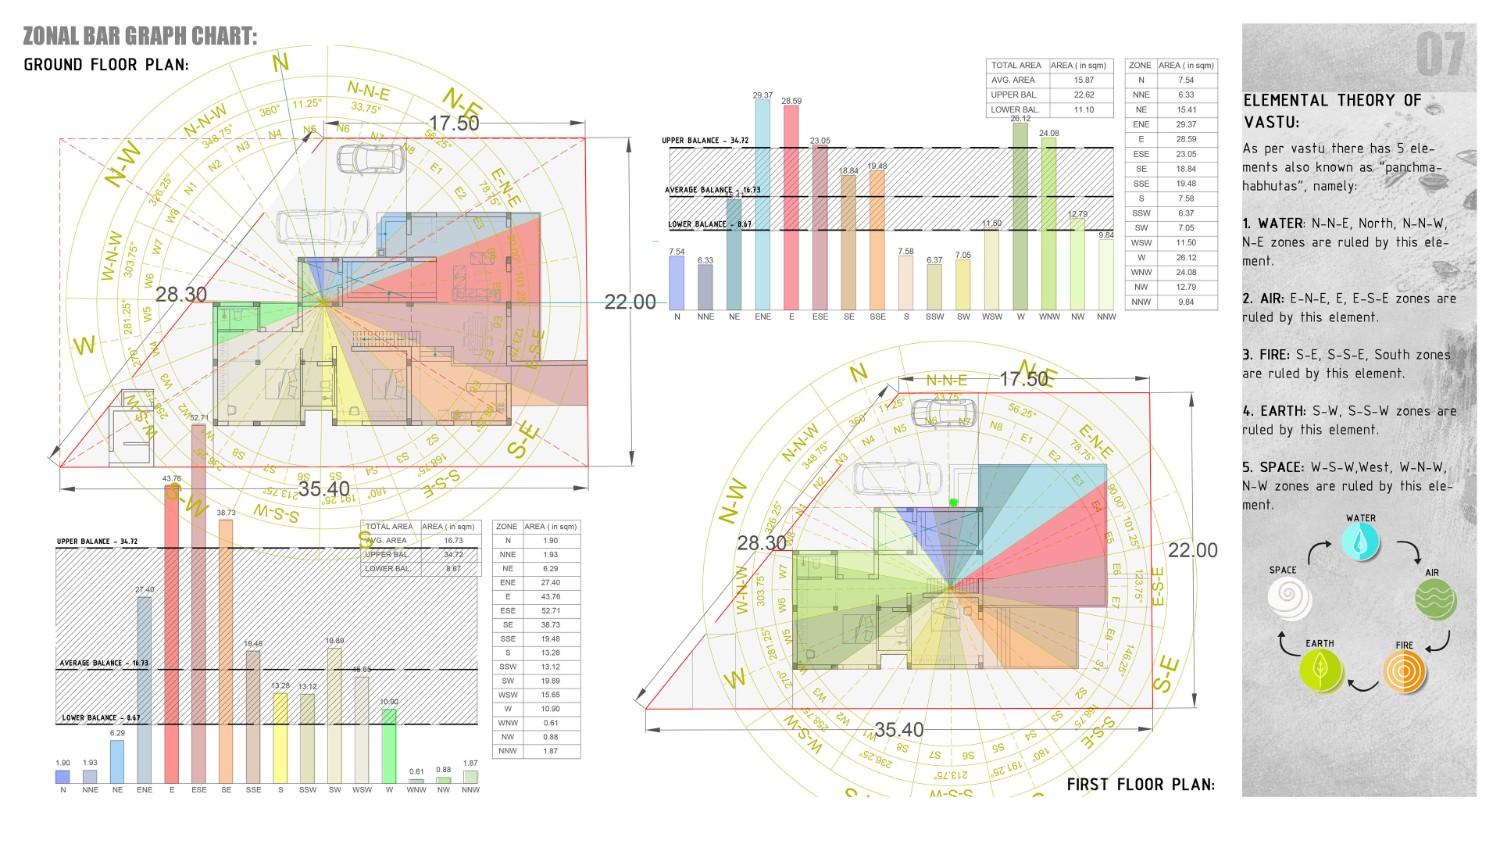
Snippet from Vastu portfolio by Kaarwan student_©Ankita Hiremath on Behance.net
Advanced Techniques for Enhancing Your Zonal Bar Graphs
For those looking to refine their Vastu design further, advanced techniques can be employed to create more detailed zonal bar graphs. These techniques involve more complex data analysis, such as integrating multiple energy factors or using 3D graphing tools. These advanced methods allow for a more nuanced understanding of your space's energy dynamics.
Incorporating Vastu Compliant Elements
To achieve a balanced Vastu design, it is important to incorporate elements that comply with Vastu principles. These can include specific colors, materials, and symbols. Integrating these elements into your space based on the insights from your zonal bar graph will significantly enhance the overall Vastu compliance of your environment.
The Role of Colors in Zonal Bar Graphs
Colors play a significant role in Vastu and can also be effectively used in zonal bar graphs. Each color corresponds to different energies and elements, helping to visually represent the energy distribution within your space. Using the right colors in your graph can make the data more intuitive and easier to interpret.
Updating Your Zonal Bar Graphs Over Time
Vastu design requires continuous assessment and adjustment. As your space changes over time, it’s important to update your zonal bar graphs to reflect these changes. Regular updates ensure that your space remains Vastu compliant, adapting to new energy dynamics as they arise.
Conclusion
Zonal bar graphs are an invaluable tool in the practice of Vastu Shastra, offering a visual and effective method to analyze and enhance the energy distribution within a space. By following the steps outlined in this guide, you can create accurate zonal bar graphs that contribute to a more harmonious and Vastu-compliant environment. Whether you’re designing a new space or refining an existing one, these graphs provide the insights needed to achieve balance and harmony in your surroundings.
Unlock the secrets of Vastu Shastra in your interior and architecture projects! Master the art of zonal bar graphs and design a balanced, vibrant home. Join our Advance Vastu Design & Compliance Course today!
Visit the Kaarwan website for more insights!
FAQs
Q1: What is the purpose of zonal bar graphs in Vastu design?
A1: Zonal bar graphs serve as visual tools to represent the energy distribution across different zones within a space. They help homeowners and designers identify areas needing adjustments to align with Vastu principles, ensuring balance and harmony.
Q2: How do zonal bar graphs simplify Vastu Shastra principles?
A2: Zonal bar graphs provide a clear, visual representation of energy flow in various building zones. This makes it easier to understand and implement the complex concepts of Vastu Shastra effectively.
Q3: What are the key steps to creating a zonal bar graph?
A3: The key steps include identifying zones within the space, assigning energy values to each zone, selecting the appropriate scale, plotting the graph, analyzing the results, and making necessary adjustments based on the analysis.
Q4: Why is zonal analysis crucial in Vastu design?
A4: Zonal analysis ensures that the energy levels in different parts of a building are in harmony with Vastu principles. It helps in identifying areas that need modification to enhance positive energy and achieve a balanced environment.
Q5: How can colors be used in zonal bar graphs for Vastu?
A5: Colors in zonal bar graphs represent different energies and elements. Using the appropriate colors enhances the graph's visual clarity, making the energy distribution within a space more intuitive and easier to interpret.