In the world of architecture and design, communicating complex ideas effectively is crucial. Data visualization in Grasshopper, a parametric design tool integrated with Rhino software, plays a pivotal role in this communication. By transforming abstract data into visual formats, designers can convey intricate concepts clearly and compellingly. This article delves into the techniques for harnessing the power of data visualization in Grasshopper, focusing on its application in Rhino architecture and parametric design.
Understanding Data Visualization in Grasshopper
What is Data Visualization in Grasshopper?
Data visualization in Grasshopper involves the use of graphical representations to illustrate data, relationships, and processes within a design framework. Grasshopper software enables designers to create parametric models that can be easily manipulated and visualized, making it an essential tool in modern architectural design.
The Role of Grasshopper in Rhino Architecture
Grasshopper is a powerful plugin for Rhino, a 3D modeling software widely used in architecture. It allows for the creation of complex, parametric designs that can be easily adjusted based on data inputs. This makes it an invaluable tool for architects and designers aiming to explore innovative forms and structures.
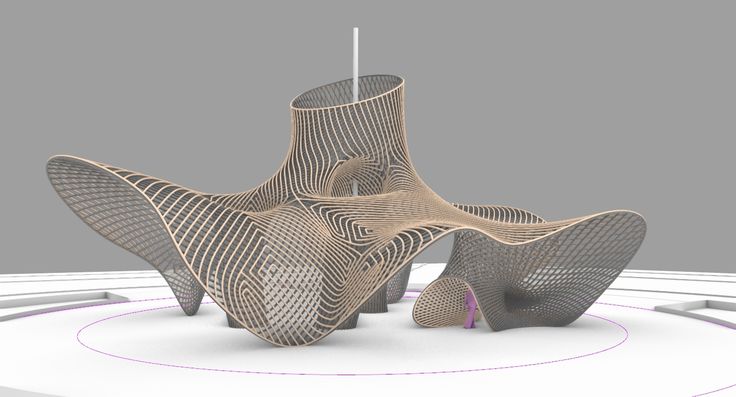
Parametric Architecture_©parametric-architecture.com
Techniques for Effective Data Visualization in Grasshopper
Utilizing Grasshopper’s Built-in Visualization Tools
Grasshopper comes equipped with several built-in visualization tools that enable designers to create a variety of graphical outputs. These include graphs, color gradients, and vector displays, which can be used to represent different data sets and their relationships within a design.
Graphs and Charts
Graphs and charts are fundamental to data visualization in Grasshopper. They allow designers to plot data points and see trends and patterns, which can inform design decisions. For example, a designer might use a graph to visualize the relationship between environmental factors and building orientation.
Color Gradients
Color gradients are another powerful visualization tool in Grasshopper. By applying color gradients to different design elements, designers can highlight specific data points or ranges, making it easier to understand complex information at a glance.
Creating Custom Visualizations with Grasshopper
While Grasshopper’s built-in tools are robust, there are times when custom visualizations are needed to convey specific concepts. Creating custom visualizations in Grasshopper involves writing scripts or using plugins to generate unique graphical outputs that meet the specific needs of a project.
Scripting in Grasshopper
Scripting in Grasshopper allows for greater flexibility and customization in data visualization. By writing custom scripts, designers can create visual representations that go beyond the standard tools, enabling them to convey more nuanced or complex information.
Using Plugins for Enhanced Visualization
Several plugins are available for Grasshopper that enhance its visualization capabilities. These plugins can add new tools, such as heat maps or flow simulations, that provide additional ways to visualize and understand data within a design context.

Parametric Architecture_©parametric-architecture.com
Applications of Data Visualization in Parametric Design Architecture
Optimizing Building Performance with Data Visualization
In parametric design architecture, data visualization is often used to optimize building performance. For example, designers can use Grasshopper to visualize how different building shapes impact energy efficiency, helping them to make informed decisions that improve sustainability.
Communicating Design Concepts to Clients and Stakeholders
Data visualization is also a powerful tool for communicating design concepts to clients and stakeholders. By visualizing design data, architects can present their ideas in a clear and compelling way, making it easier for non-experts to understand complex design proposals.
Exploring and Refining Design Ideas
Grasshopper’s data visualization tools allow architects to explore and refine their design ideas iteratively. By visualizing different design scenarios, designers can quickly assess the impact of changes and make adjustments to improve the overall design.
Learning Data Visualization in Grasshopper: The Rhino Course
Why Take a Rhino Course?
For those new to Grasshopper and Rhino architecture, taking a Rhino course is an excellent way to build foundational skills in data visualization and parametric design. These courses typically cover the basics of Grasshopper software, as well as advanced techniques for creating complex designs and visualizations.
What to Expect in a Rhino Course
A comprehensive Rhino course will cover both the theoretical and practical aspects of using Grasshopper for data visualization. Students can expect to learn about the different tools and techniques available in Grasshopper, as well as how to apply these skills in real-world design projects.
Advanced Visualization Techniques in Grasshopper
Using Data Visualization for Environmental Analysis
One of the advanced applications of data visualization in Grasshopper is environmental analysis. By visualizing data such as solar radiation or wind patterns, architects can design buildings that respond to their environment, improving energy efficiency and occupant comfort.
Visualizing Structural Behavior in Parametric Design
Another advanced technique is the visualization of structural behavior. Grasshopper can be used to simulate and visualize how different design elements behave under various loads, helping architects to create structures that are both aesthetically pleasing and structurally sound.
Integrating Data from External Sources
Grasshopper allows for the integration of data from external sources, such as weather data or site measurements. By visualizing this data within the design, architects can make informed decisions that are grounded in real-world conditions.
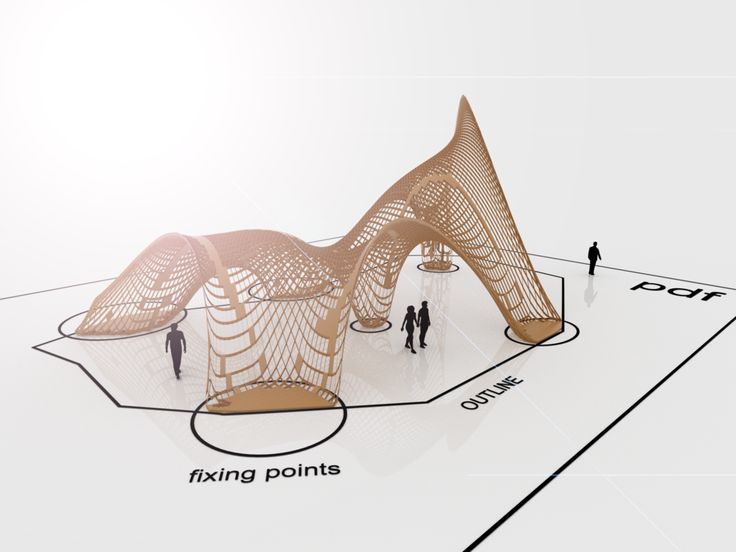
Image source_©pinterest.com
Challenges in Data Visualization and How to Overcome Them
Dealing with Large Data Sets
One of the challenges in data visualization is managing large data sets. Grasshopper’s parametric nature means that even small changes can result in significant amounts of data. To overcome this, designers can use techniques such as data filtering or aggregation to simplify the visualization process.
Ensuring Clarity and Accuracy
Another challenge is ensuring that visualizations are both clear and accurate. Overcomplicated or poorly designed visualizations can lead to misunderstandings or misinterpretations. To avoid this, designers should focus on creating visualizations that are easy to understand and that accurately represent the underlying data.
Conclusion: Mastering Data Visualization in Grasshopper
Harnessing the power of data visualization in Grasshopper is essential for effective communication in parametric design architecture. By understanding and applying the techniques discussed in this article, architects and designers can create visualizations that not only convey complex ideas clearly but also enhance the overall design process. Whether through built-in tools, custom scripts, or advanced plugins, the ability to visualize data in Grasshopper opens up new possibilities for innovation and creativity in architecture.
Elevate your skills with our Advanced Rhino & Grasshopper Certification Course. Gain expertise and job support to excel in parametric design. Enroll now to transform your career!
Visit the Kaarwan website for more insights!